Inline Diagrams in Orgmode

Of course it is easy to include a diagram with a post, but the standard procedure to create/edit the diagram with an external GUI tool does not resonate with me. Even back in my diploma thesis I fell in love with Donald Knuth's MetaPost system to describe diagrams in a declarative way and let the tool do the drawing.
For some LaTeX Beamer presentations I used ditaa in the meantime but inside a make flow that took care of the dependencies. The diagrams and the presentation were strictly separated. For the blog posts I did not yet have a good solution, until I switched to blogging in orgmode. Compared to ReST and Asciidoc posts, Emacs orgmode provides a much richer ecosystem with lots of hooks into other systems by means of the org-babel system.
So by switching the post source format, blogging in orgmode should actually hook into e.g. Graphviz out of the box. And indeed with a little fine tuning, this is an amazingly elegant way to include visualizations in the posts.
As org-mode (through exporting to LaTex Beamer) has also become the source format of my presentations, this new freedom easily extends into presentations and even regular PDF documents by exporting to LaTeX only. So the means shown here to produce diagrams for the blog are also usable when you want to generate Beamer presentations or LaTeX documents. As we will see, the choice of output formats is linked to the targeted use-case.
Orgmode and org-babel
The foundation of using this class of diagrams is the org-babel
system. It took me a light tweaking of the orgmode installation, and
without further ado, here is the complete use-package clause I
currently use for my setup:
;; -------------------------------------
;; Org mode
;; -------------------------------------
(use-package org-mode
  :init
  ;; This allows PlantUML, Graphviz and ditaa diagrams
  (org-babel-do-load-languages
   'org-babel-load-languages
   '((ditaa . t)
     (dot . t)
     (plantuml . t)))

  :hook
  (org-babel-after-execute . org-redisplay-inline-images)

  :custom
  (org-edit-src-content-indentation 0)
  ;; PlantUML was too old on Debian Bookworm, so a recent copy is
  ;; installed in /usr/local/share
  (org-plantuml-jar-path "/usr/local/share/plantuml/plantuml.jar")
  ;; ditaa installed through dpkg on Debian
  (org-ditaa-jar-path "/usr/share/ditaa/ditaa.jar")
  ;; Do not ask before evaluating a code block
  (org-confirm-babel-evaluate nil)
  ;; Fix for including SVGs
  (org-latex-pdf-process
   '("%latex -shell-escape -interaction nonstopmode -output-directory %o %f"
     "bibtex %b"
     "%latex -shell-escape -interaction nonstopmode -output-directory %o %f"
     "%latex -shell-escape -interaction nonstopmode -output-directory %o %f"))
  )
The list for org-babel-load-languages specifies the languages that
we want org-babel to process. Nothing special here. The :hook
clause adds a call to org-redisplay-inline-images on the
org-babel-after-execute-hook (note that the :hook syntax of
use-package inserts the -hook suffix of the customized hook by
itself). This will redisplay the images in the buffer after
generating them with C-c C-c.
PlantUML and ditaa are Java based tools and so we need to specify
the path to the jar files. Note that currently Debian Bookworm still
carries "1.2020.02" and the support for the new activity diagrams is
not up to the documentation on the web. So I simply downloaded a
newer version of the jar file to /usr/local/shar/plantuml and
specify this version to orgmode.
Setting org-confirm-babel-evaluate to nil spares me to answer
"yes" on every run of the org-babel flow. And finally messing with
org-latex-pdf-process is nothing that I like to do, but for SVG
support, it is required to have the -shell-escape argument on the
LaTeX command line.
Without a further trick, the images will not be displayed when visiting such an orgmode document for the first time. We can fix this by including a STARTUP option:
#+STARTUP: inlineimages
With all this in place, creating a diagram is as easy as inserting a
source code block with the correct type and pressing C-c C-c inside
it. org-babel will then evaluate the code block, i.e. run the
external tool and insert a link to the resulting file into the buffer.
As orgmode honors the :exports option on such source blocks and for
diagrams they default to output rather than code, so the export
will only have the diagram and leave out the source code. Specifying
:exports both (like done below) will export both sections, making it
extra easy to show the source code and the result in a document.
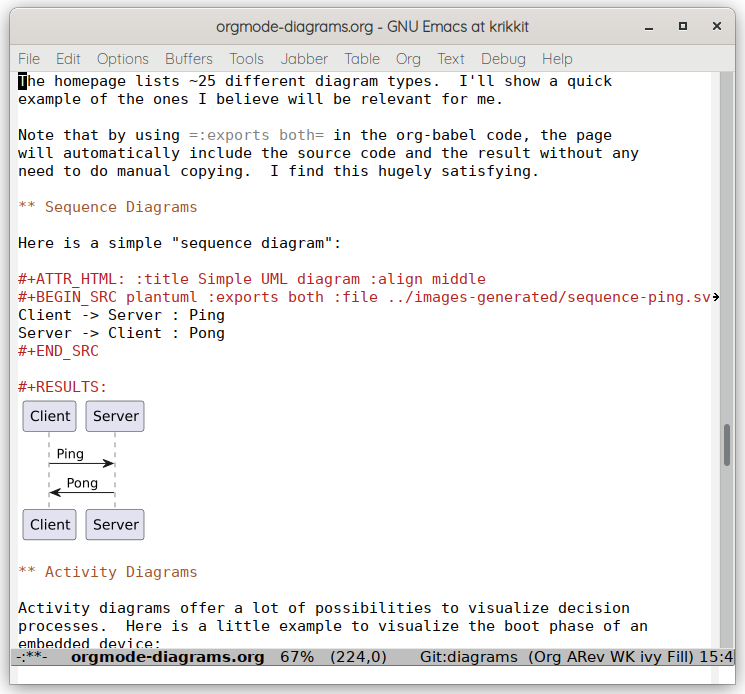
Here is a screen shot of Emacs displaying parts of this post:
Graphviz
The dot language from the Graphviz package allows us to draw images like the one at the top of the post. The language only describes the entities in the diagram and their relationships. Positioning is done by the tool automatically with the help of hints that we can include in the representation like connection weights, etc.
The list of possible output formats (specified with -T) is very
extensive and includes:
- PNG
- SVG
- EPS
For best results, I always try to use vector based formats, so they can be scaled to the intended target resolution without loss of quality. I really do hate graphics included into documents with a low quality, but I will return to the choice of output formats in a later section.
This is the source for the diagram at the top of this post:
digraph G {
  { rank=same;HTML;PDF; }
  { rank=same;Orgexport;Nikola; }
  Orgbabel [color=lightblue,style=filled,label="org-babel (ob)"];
  Orgmode [color=limegreen,style=filled];
  Graphviz [color=lightblue,style=filled];
  PlantUML [color=lightblue,style=filled];
  others [color=lightblue,style=filled,label="..."];
  Orgexport [color=gold,style=filled,label="org-export (ox)"];
  LaTeX [color=gold,style=filled];
  Beamer [color=gold,style=filled];
  PDF [color=gold,style=filled];
  HTML [color=gold,style=filled];
  Orgnikola [color=orange,style=filled,label="org-nikola"];
  Nikola [color=orange,style=filled,label="Nikola (blog)"];
  Orgbabel -> Orgmode -> Orgbabel;
  Orgbabel -> Graphviz -> Orgbabel;
  Orgbabel -> PlantUML -> Orgbabel;
  Orgbabel -> others -> Orgbabel;
  Orgmode -> Orgexport [weight=2];
  Orgexport -> HTML;
  Nikola -> Orgnikola -> Orgexport;
  Nikola -> HTML;
  Orgexport -> LaTeX;
  Orgexport -> Beamer;
  LaTeX -> PDF;
  Beamer -> PDF;
}
PlantUML
PlantUML is another package to generate diagrams from textual descriptions. It originated with UML diagrams, but nowadays supports a lot of other attractive diagram types. It also is capably of generating a lot of different output formats, again including:
- PNG
- SVG
- EPS
So PlantUML can also be used to generate high quality vector graphics,
preventing nasty bitmap artifacts from scaling. Actually PlantUML
derives the output type from the output filename, so it is enough to
specify graph.svg as the output file to generate SVG.
The homepage lists ~25 different diagram types. I'll show a quick example of the ones I believe will be relevant for me.
Note that like mentioned above, using :exports both in the org-babel
code will automatically include the source code and the result without
any need of manual duplication. I find this hugely satisfying.
Sequence Diagrams
Here is a simple "sequence diagram":
Client -> Server : Ping
Server -> Client : Pong

Activity Diagrams
Activity diagrams offer a lot of possibilities to visualize decision processes. Here is a little example to visualize the boot phase of an embedded device:
@startuml
:FSBL;
:U-Boot;
if (SD card\nfound) then (yes)
  :Load kernel\nfrom SD;
  :Setup cmdline for\nrootfs from SD;
elseif (USB medium\nfound) then (yes)
  :Load kernel\nfrom USB;
  :Setup cmdline for\nrootfs from USB;
elseif (eMMC found) then (yes)
  :Load kernel\nfrom eMMC;
  :Setup cmdline for\nrootfs from eMMC;
else (nothing)
  #pink:Drop to shell;
  kill
endif
:Boot Linux kernel;
@enduml

Mind Maps
This diagram type allows nice visualizations of hierarchies. Here is a little example visualizing Zephyr OS:
@startmindmap
+[#FFBBCC] Zephyr OS
++[#lightblue] 3rd Party Libraries
++[#FFBBCC] Application Services
+++[#FFBBCC] MQTT
+++[#FFBBCC] HTTP
+++[#FFBBCC] CoAP
++[#FFBBCC] OS Services
+++[#FFBBCC] TCP/UDP
+++[#FFBBCC] I2C
+++[#FFBBCC] File system
++[#FFBBCC] Kernel
+++[#FFBBCC] Services / Scheduler
+++[#FFBBCC] Power Management
++[#lightblue] HAL
@endmindmap

Ditaa
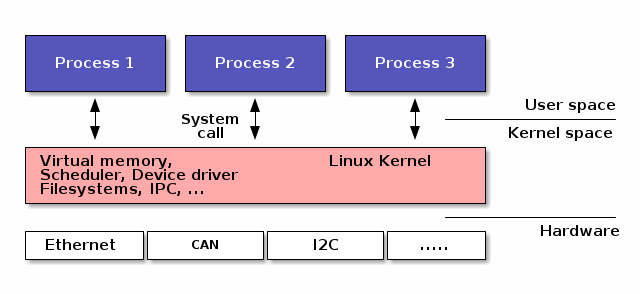
Diagrams Through Ascii Art (ditaa) is a different approach to generating diagrams from text. Instead of using declarative languages, the "source code" is an Ascii drawing generated by any means preferred by the user.. A plain text editor will do, or Artist Mode within the Emacs text editor is an especially elegant way to draw them. Ditaa will then convert this into a nice looking diagram, albeit only as a bitmap, e.g. PNG. It is not possible to generate an SVG with Ditaa, but we can circumvent this by using the Ditaa integration into PlantUML. As PlantUML can output SVG files, we gain one degree of freedom for high quality output by going this way.
Here is a simple example showing the user vs. kernel space split of a regular Linux kernel:
@startditaa
+-------------+ +-------------+ +-------------+
|cBLU         | |cBLU         | |cBLU         |
|  Process 1  | |  Process 2  | |  Process 3  |
|             | |             | |             |
+-------------+ +-------------+ +-------------+
       ^               ^               ^          User space
       |        System |               |  ------------------
       v         call  v               v        Kernel space
+---------------------------------------------+
| Virtual memory,        cPNK Linux Kernel    |
| Scheduler, Device driver                    |
| Filesystems, IPC, ...                       |
+---------------------------------------------+
                                          ------------------
+-----------+-----------+-----------+---------+     Hardware
| Ethernet  |    CAN    |    I2C    |  .....  |
+-----------+-----------+-----------+---------+
@endditaa
Which file format?
Knowing our tools, let's think about which of the file formats to use. As a summary, both tools support these relevant types:
- PNG (pixel based)
- EPS (vector based)
- PDF (vector based)
- SVG (vector based)
Whenever possible, we should use one of the vector based formats, but we have to be sure that the rest of our "toolchain" can handle those formats. So let's discuss the use-cases I care about.
HTML output (blog)
As most browsers nowadays support SVG, I will use SVG for the blog. Indeed all pictures in this post are SVGs. Whenever you think this will be problematic, switching to PNG is easy.
LaTeX output (plain and beamer)
LaTeX can easily digest PDF and EPS diagrams, so it is conceivable to use those formats for the LaTeX export. The drawback of this approach is that Emacs is currently not able to preview either PDF or EPS files in the buffer like shown in the previous screenshot. Although this may change, it is enough for me to opt for SVGs also in this use-case.
Using SVG in LaTeX requires the svg and svg-extract packages to work. In this setup, LaTeX can even extract the text components of an SVG and render them with its own fonts (even allowing LaTeX maths). This is somewhat overkill for my usecase and does not interoperate nicely with the Emacs preview, so I disable it in the LaTeX preamble. For an orgmode buffer, this can be achieved like this:
#+latex_header: \usepackage[inkscapelatex=false]{svg}
Summary
It took quite a bit of experimentation to arrive at this setup, but it was certainly worth it:
- I can now easily create high-quality diagrams not only in blog posts, but also in PDF documents and presentations. Sharing material is as easy as copying text blocks around.
- Creating and modifying the diagrams is part of the writing process and does not involve any other program.
- As the diagrams are text constituents of the files, they will automatically be checked into version control and even differences in the diagrams itself are documented this way fully transparently. This is the logical extension of generating code documentation from the code itself.
Update 2024-02-22
Added PlantUML Mindmap example
Comments
Comments powered by Disqus